Yes65%
No35%
Sep 2Sep 9Sep 16Sep 24Oct 2
100%75%50%25%0%
The outcome is decided by the Rail Freight Carloads value for August 2026 in the Bureau of Transportation Statistics (BTS) Transportation Services Index and Seasonally-Adjusted Transportation Data release, taken from the matching column of that dataset. The outcome is Yes if that figure is above the value specified in the market question and No otherwise. The outcome is determined when BTS releases the index, typically at 8:00 AM CT in the second week of the month, about two months after August 2026. Early resolution does not apply, and if the release is delayed, resolution waits until it is published.
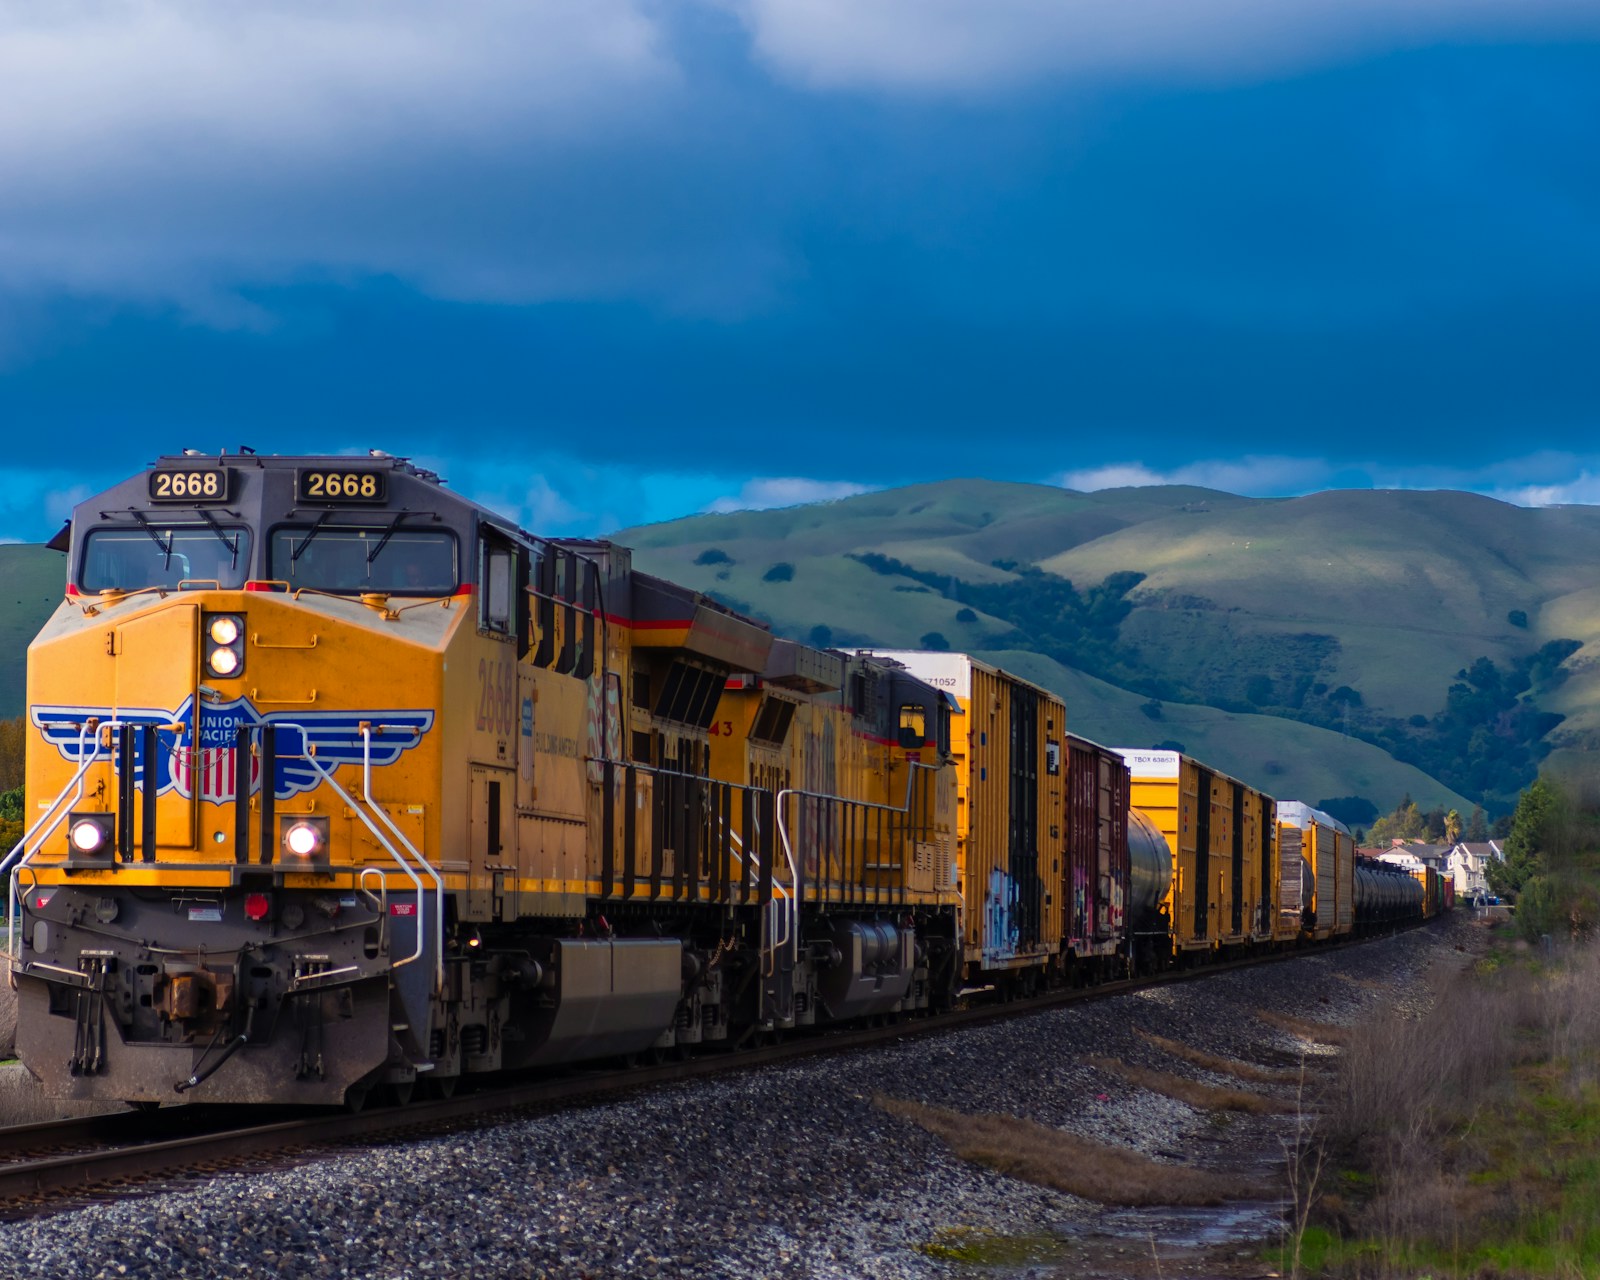
Rail freight volumes measure how much cargo moves across the US rail network. The measure is total US rail freight carloads for August 2026, counted as the number of rail cars loaded with freight.
The outcome is decided by the Rail Freight Carloads value for August 2026 in the Bureau of Transportation Statistics (BTS) Transportation Services Index and Seasonally-Adjusted Transportation Data release, taken from the matching column of that dataset. The outcome is Yes if that figure is above the value specified in the market question and No otherwise. The outcome is determined when BTS releases the index, typically at 8:00 AM CT in the second week of the month, about two months after August 2026. Early resolution does not apply, and if the release is delayed, resolution waits until it is published.
Rail freight volumes measure how much cargo moves across the US rail network. The measure is total US rail freight carloads for August 2026, counted as the number of rail cars loaded with freight.